Group Visualization with [i]Group Explorer[/i]
Nathan Carter is in the Department of Mathematical Sciences at Bentley College. Brad Emmons is an Assistant Professor of Mathematics at Utica College.
Computer teaching aids have been making inroads into abstract algebra classrooms for several years, yet their visualization capabilities have not nearly reached their full potential. Group Explorer specifically targets graphical representation of groups for building intuitions and offers a number of features not yet found in any other package. We review its features and give an example of how it can be brought into the classroom for an intuition-building lesson.
© 2005 by Nathan Carter and Brad Emmons
Published December, 2005
Group Visualization with [i]Group Explorer[/i] - Summary
Nathan Carter is in the Department of Mathematical Sciences at Bentley College. Brad Emmons is an Assistant Professor of Mathematics at Utica College.
Computer teaching aids have been making inroads into abstract algebra classrooms for several years, yet their visualization capabilities have not nearly reached their full potential. Group Explorer specifically targets graphical representation of groups for building intuitions and offers a number of features not yet found in any other package. We review its features and give an example of how it can be brought into the classroom for an intuition-building lesson.
© 2005 by Nathan Carter and Brad Emmons
Published December, 2005
Group Visualization with [i]Group Explorer[/i] - Group Theory Visualization
Most branches of mathematics use images to help communicate their content. Calculus teachers show animations of shrinking rectangles under a curve to demonstrate Riemann sums. Topology instructors draw epsilon balls on a surface because the images serve to illuminate the matter under discussion. Although it would be possible to communicate the material using only the medium of mathematical symbols, such a method is universally recognized as inferior -- it communicates far less intuition about the subject matter. Why, then, do we not use images in our introductory abstract algebra courses? This is an area where the common pedagogy is ripe for improvement.
We designed Group Explorer as part of discussions stemming from a Group Theory Visualization course Douglas Hofstadter offered at Indiana University in the fall of 2002; Doug was also part of the design team. The course demonstrated the potent intuition-building value of illustrations such as Cayley diagrams, multiplication tables, and objects of symmetry. Group Explorer was designed to automate the creation of such diagrams, and allow users to interact with and manipulate them in meaningful ways.
One of us (NC) began the development in 2003 as part of work toward an MS in Computer Science at Indiana University, and the first version was released in the summer of 2003. Later versions followed, and this article surveys version 1.5.8. (Version 2.0 has many more features but is in beta testing at the time of writing.) You are encouraged to browse the Group Explorer Web site; all versions of the software are free to download and use, and later versions are open source.
Several popular abstract algebra texts treat visual topics such as Cayley diagrams and multiplication tables, but not to their full potential. Gallian (2001) and Fraleigh (2002) are rare in that they mention Cayley diagrams, but they do not do very much in the way of visualization, and Gallian focuses on their graph theoretic properties rather than using them as a visualization tool. Grossman & Magnus (1975) spend quite a bit of time on visual group theory, but their text is not designed for a typical introductory algebra course. Hibbard & Maycock (2002) include many enlightening articles in their recent volume on abstract algebra pedagogy, and much of it involves software, e.g., Finite Group Behavior (Webb & Keppelman, 2004) and AbstractAlgebra (Hibbard & Levasseur, 2002), but very useful visualization techniques, such as Cayley diagrams, remain unaddressed. Group Explorer has a very different focus from software packages such as GAP (2004) and Magma (2005), which are designed to be powerful computational languages. Group Explorer was designed to show groups to teachers and students.
In this article, we give a tour of the most important features of Group Explorer and use it to demonstrate a foundational concept in group theory. This demonstration is suitable for standalone reading by teacher or student or presentation by an instructor in a classroom.
Group Visualization with [i]Group Explorer[/i] - Features: Visualization through Cayley Diagrams
Group Explorer's chief benefit is that it provides illustrations of objects and concepts from group theory that would otherwise be unavailable or cumbersome to create. The program automates the process of drawing and manipulating illustrations, such as Cayley diagrams and multiplication tables, to take the burden away from the user. But we haven't said yet what a Cayley diagram is. Before we continue, let us first introduce some important concepts on visualization in group theory.
There are several ways to visualize a group. The most significant and intuitive way was invented by the British mathematician Arthur Cayley and has been called the "Cayley diagram" after him. It has two major advantages over other visualization techniques. First, it clearly represents a group as a set of elements. This may not seem at first like anything significant, but we will see that other visualization techniques (e.g., multiplication tables or objects with symmetries) either do not directly represent the elements of the group or represent them redundantly. Second, by taking advantage of the group's generators, Cayley diagrams fully illustrate the interactions among the elements of the group while remaining minimally cluttered. As an added advantage, they are often quite pretty -- three examples appear in Figures 1 through 3. Each of these images was generated with Group Explorer.
Note: The notation aa in Figure 1 is more commonly written a2.
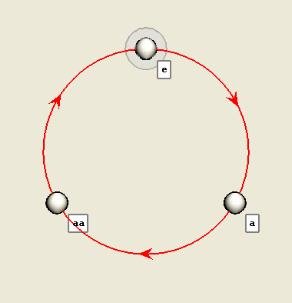
Figure 1. Cayley diagram of Z3
A Cayley diagram is a directed graph, or digraph. Each node of the graph represents one element of the group, and each type of directed edge represents a generator. In Figure 1 there are three nodes, each representing one of the three elements of the group; they are labeled e for the identity, a for the generator, and aa for the generator squared. And the red arrows show that multiplying by the generator a maps e to a, a to aa, and aa back to e. It is quite clear from the picture why this group is called "cyclic." Although Figure 1 is the only one on this page that explicitly names the elements of the group, each of Figures 1 through 3 highlights the identity element with a faint, round halo.
In the event that the group is not cyclic, there will be more than one generator, and thus more than one type of edge in the digraph. Figure 2 is the Cayley diagram of the smallest non-abelian group, S3, and its two generators are distinguished by color. The red arrows show the action of the order-3 generator, and the blue edges show the action of the order-2 generator. (The latter edges have no arrowheads because the generator is of order 2, and thus applies in both directions.)
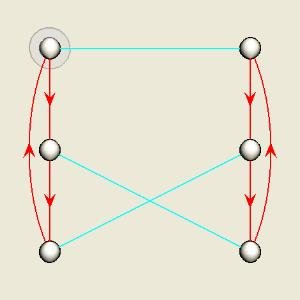
Figure 2. Cayley diagram of S3
A non-abelian group will contain a pair of generators that do not commute, and thus it will always be evident from the Cayley diagram whether or not a group is abelian. To see this in Figure 2, beginning with any element in the diagram, follow a red arrow and then a blue edge, and remember where you end up. Then repeat the experiment from your original starting place, but follow a blue arc first, then a red one. You will end at a different node.
Figure 3 shows a Cayley diagram for the symmetric group S4 and introduces one of the more basic modifications one can make to the plain vanilla Cayley diagram -- the nodes are colored to distinguish cosets of a three-element subgroup. (The subgroup itself is the set of three yellow nodes near the bottom containing the identity.) A more in-depth introduction to Cayley diagrams can be found in Fraleigh (2002), and a thorough treatment appears in Grossman & Magnus (1975), beginning in chapter six.

Figure 3. Cayley diagram of S4
Group Visualization with [i]Group Explorer[/i] - Features: From Images to Interactivity
A picture may be worth a thousand words, but an interactive experience is far superior. Group Explorer provides several tools for manipulating the objects viewed, asking questions about them, and experimenting with them.
- Cayley diagrams reside in 3-space, and the mouse can be used to rotate any Cayley diagram in real-time on screen. We can therefore examine it from any angle and get a clearer understanding of its shape and meaning.
- Many options for viewing Cayley diagrams are available, including labeling of nodes, selection of generators, representation of elements, styles and sizes of arrows and nodes.
- Specific features of a group such as cosets and subgroups can be highlighted for clarity.
- The structure of the diagram can be altered according to the user's preferences, including choosing the overall shape, adjusting the priority of the generators, and focusing on a subgroup.
- Information can be calculated about the group and reported visually in the Cayley diagram -- e.g., information about orbits, subgroups, cosets, conjugacy classes, order classes, normalizers, or centralizers.
- Several views of the same group can be shown simultaneously, and Group Explorer keeps them synchronized. This allows you to treat the Cayley diagram as a map of the group and use it to navigate other representations (e.g., an object with symmetries, as we will see on the next page).
In later pages, we discuss how these features combine to provide a useful tool for learning about groups, both inside and outside the classroom. To learn how to use some of these features, refer either to those pages or to the Group Explorer User Manual online (Carter, 2004).
Group Visualization with [i]Group Explorer[/i] - Features: More Visualization Techniques
Before reading this article, you may not have heard much about Cayley diagrams. More common techniques for visualizing groups include multiplication tables (or "Cayley tables") and three-dimensional objects of symmetry. Group Explorer also has the capability to use each of these visualization techniques, and we discuss each briefly here. Group Explorer also comes with a "Permutation View," a "History View," and a "Group Navigator," but they are less commonly used, and so we do not address them here. For more information, refer to Carter (2004).
Multiplication tables are probably the most common means for visualizing a group -- most introductory group theory textbooks discuss them. They have the advantage of fully displaying the group operation, and thereby exhibiting some of the patterns in that operation. But this comes at the expense of not giving a clear picture of the set of elements of the group, except redundantly (on each axis, and throughout the table). Figures 4 through 6 show the multiplication tables for the same three groups whose Cayley diagrams appeared in Figures 1 through 3; the Cayley diagrams are repeated for ease of comparison. The background color of a cell in the table is determined by the element in that cell, to more readily illustrate patterns in the group operation.

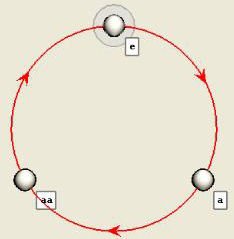
Figure 4. Multiplication table and Cayley diagram for Z3
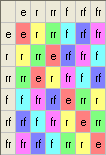

Figure 5. Multiplication table and Cayley diagram for S3
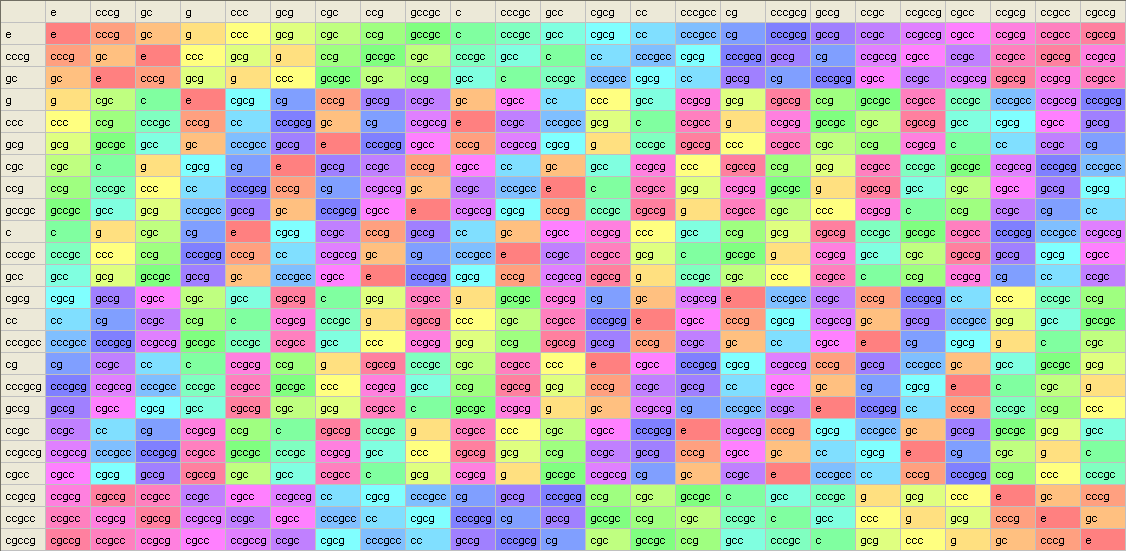
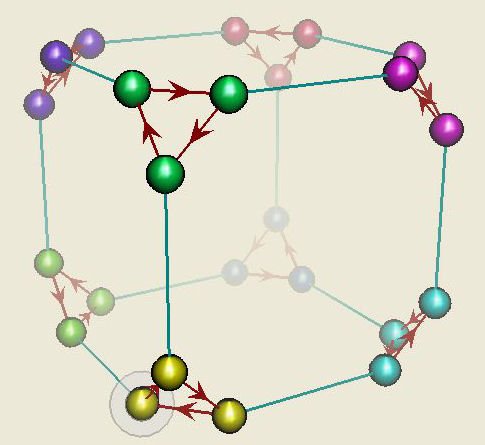
Figure 6. Multiplication table and Cayley diagram for S4
In Group Explorer you may explore the tables interactively just as you can the Cayley diagrams. You can choose the order of the elements along the axes and the generators and their priority, you can focus on subgroups, cosets, and you can do numerous computations about the group in question.
Furthermore, because Group Explorer can display many views of a group simultaneously and keep them synchronized, if an element is highlighted in a Cayley diagram view, then that same element will be highlighted in the multiplication table view. Figure 7 shows a screen shot of Group Explorer with several different windows available for the group Z9. These views are available for most groups of small order.
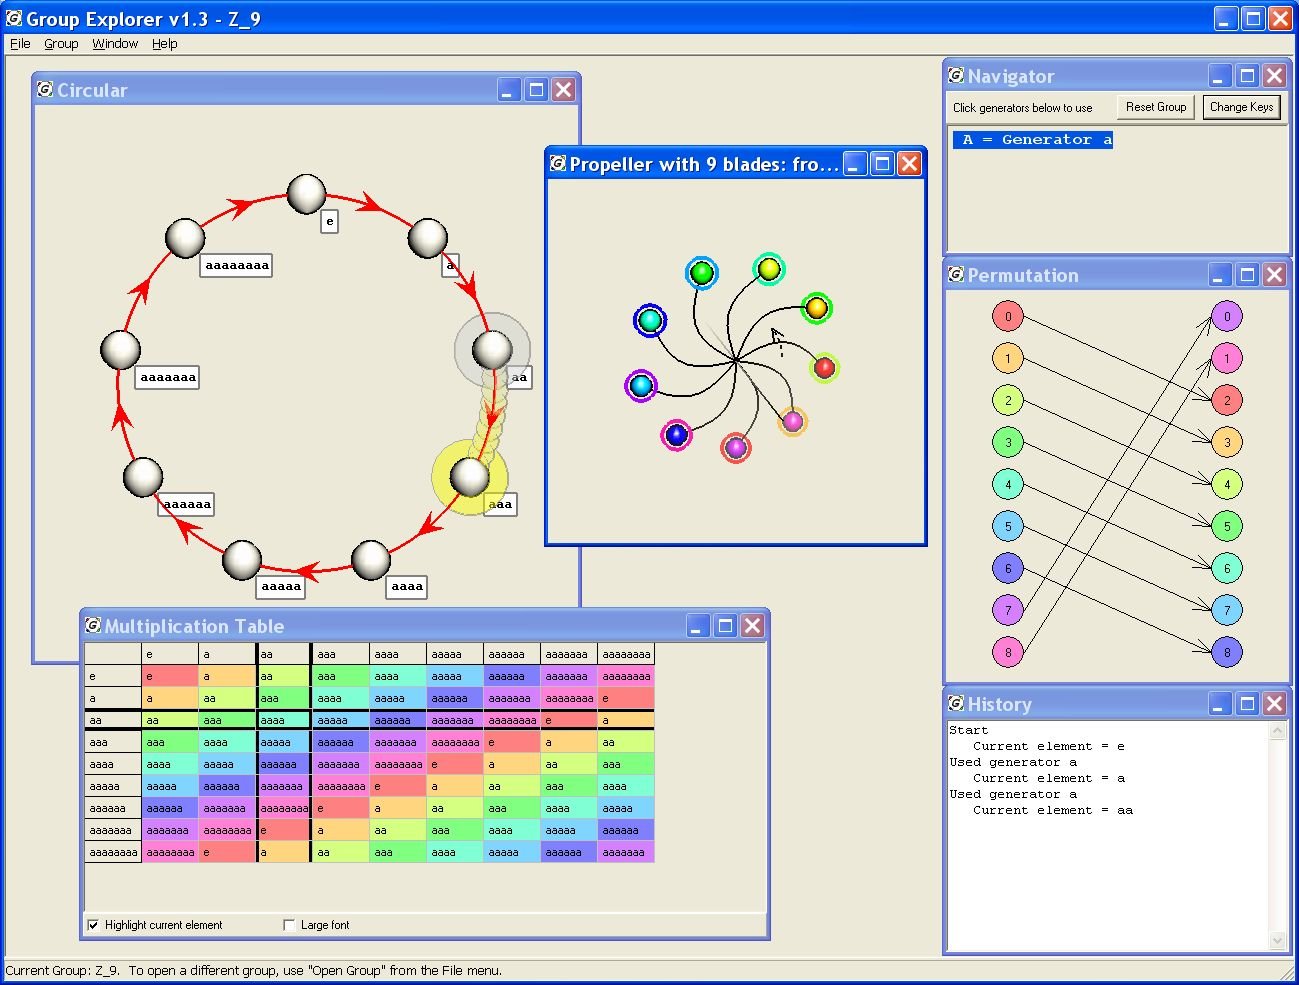
Figure 7. Group Explorer viewing Z9 using several different visualization media
Now that we have introduced Group Explorer a bit, let us see how these images (and interacting with them) can be used to help us learn about groups.
Group Visualization with [i]Group Explorer[/i] - In the Classroom: A Subgroup Example
Group Explorer can be used in a variety of ways to enhance understanding in the abstract algebra classroom. We have already mentioned some basics -- for instance, how a Cayley diagram can be used to see whether a group is abelian. But some of the more difficult concepts that come up early in abstract algebra studies can be illustrated as well.
Consider, for instance, normal subgroups and quotient groups and how these concepts relate. On this page and the next, we describe a demonstration with the dynamic nature of Group Explorer that can help us see what a quotient group is. We will walk through all of the steps that manipulate an ordinary Cayley diagram of the group A4 into a more useful diagram for visualizing the quotient of A4 by a subgroup isomorphic to V4, the Klein 4-group, which is isomorphic to Z2 x Z2. We proceed as if you are following along using Group Explorer. But, because each step is illustrated, you can also follow along without having the software at all.
Note: We consistently use the term "quotient group", which is synonymous with "factor group".
We assume that you have heard of normal subgroups before, and our aim is illustrate them, to give you some visual intuition to associate with this concept. As a quick refresher, normal subgroups are those subgroups that allow you to form a quotient group; that is, H is a normal subgroup of G just when you can form a quotient group G/H.
If you are an instructor considering using this tutorial in class, you might want to ensure that your students know that A4 has a normal subgroup isomorphic to V4. In fact, you may get your students to discover this by assigning them the task of drawing a subgroup lattice for A4, and identifying which subgroups are normal. The "highlight" feature of Group Explorer's views can be used by students to help them find and identify (normal) subgroups.
Viewing and Rearranging a Diagram of A4
Begin by opening the rectangular Cayley diagram for A4: Use the Open command from the File menu to open the group A4. From the Group menu, choose Create Cayley diagram, and then rectangular. Your diagram should look like Figure 8. This diagram is not particularly attractive -- we have asked Group Explorer to arrange the nodes in a rectangle because we intend to manipulate this diagram to suit our needs in the steps to come.

Figure 8. Default rectangular Cayley diagram for A4
We want to manipulate this diagram to organize it around the subgroup isomorphic to V4. Right-click on the Cayley diagram and choose Edit diagram to bring up an edit window. Using the Define H and a tab on that window, add the elements (0 1)(2 3) and (0 2)(1 3) to the subgroup H. These two elements generate the subgroup isomorphic to the Klein 4-group V4. The portion of your Edit Cayley Diagram window that corresponds to the definition of H will look like Figure 9.

Figure 9. Editing the diagram to show an order-4 subgroup
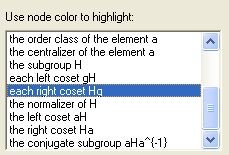 |
Figure 10. Highlighting
|
Now switch over to the Highlight tab so that we can make use of the subgroup H we have defined. Under Use node color to highlight, choose each right coset Hg, as shown in Figure 10. When you click Apply, your diagram will be partitioned into three distinct classes by color, each color representing a right coset Hg of the subgroup H in A4. Your diagram should look like Figure 11, which shows us how the group is partitioned by the right cosets of H. This colorization is accurate, but it does not yet help exhibit the structure of the group with respect to these cosets. We therefore ask Group Explorer to rearrange the diagram according to our colorization.
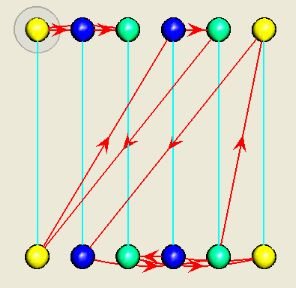
Figure 11. Cosets highlighted, but arrangement unchanged
To reorganize the diagram by cosets, so that things of like color will be grouped together, go to the Axes & Priority tab and click the Organize diagram by H button. Your grid of generators, priorities, and axes, should then look like Figure 12. When you click Apply, your diagram will be modified to look like the three-dimensional shape in Figure 13.

Figure 12. Generators organized to respect cosets

Figure 13. Diagram organized by cosets
This arrangement of generators, priorities, and axes is Group Explorer's best guess as to what would be best suited for the eye. However, things are still a bit difficult to see here, even though some order is apparent. But if we spin this shape a bit to the right, we can line up in our view the yellow, blue, and green nodes in columns, as in Figure 14.

Figure 14. Clearer view of the order in Figure 13
Now we choose a different assignment of axes so that we can see the quotient group structure more clearly. On the Axes & Priority tab of the Edit Cayley Diagram box, go to the drop-down list next to the Change all axes to: button and choose the Ring of rectangles item. Click the Change all axes to: button to have this choice impact the axes in the grid. When you click Apply, your diagram will then look like Figure 15. Not only can we now see how the group is partitioned into cosets, but we also begin to see some of the interaction among these cosets.

Figure 15. A planar representation of Figure 14
Group Visualization with [i]Group Explorer[/i] - Exhibiting Quotient Group Structure

Figure 16. Check boxes for chunking the diagram
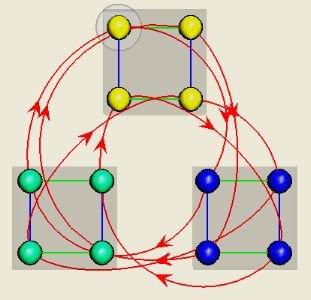
Figure 17. The quotient group of A4 by V4
Group Explorer has done two things here that make Figure 17 extremely helpful for visualizing the quotient group. First, it put translucent gray boxes around the cosets of H so that you can more easily think of them as single units, which is the first step in understanding a quotient group. Second, it brought the arrowheads on the red arrows near to one another so that they cluster nicely. This demonstrates that the red generator operates uniformly on each coset.
At this stage you can see that the red arrows that leave the top coset (the four yellow nodes) all move to the (blue) coset at the right. That is, the red arrows take the four yellow nodes to the four blue nodes. Similarly, they take the blue coset to the green coset, and then the green coset back to the yellow coset.
Now you can see the quotient group A4/V4 by mentally taking a few steps back from the image in Figure 17, viewing each coset as a unit and each bundle of arrows as a single arrow. There are three cosets and the bundles of arrows march through the cosets in a cyclic fashion. So we can see that the quotient group is isomorphic to the cyclic group Z3.
|
|
Figure 18. Organization by a
|
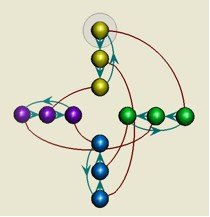
Here we notice that the right cosets are grouped together as before. However, the red edges do not move uniformly from one coset to another, but rather they head off in different directions. For example, if we follow the red arrow from the top element of the yellow coset, we end up at the green coset. If we follow it from the middle element of the yellow coset, we end up at the blue coset. And if we follow the red arrow from the bottom element, we end up at the purple coset. This demonstrates a fundamental feature of normal subgroups: the operation on cosets is well-defined if and only if the subgroup is normal.
Instructors will appreciate how the dynamic nature of Group Explorer can help students gain a fuller appreciation of a concept in just a few minutes of class time that would take significantly longer without the software. On your own, consider inspecting a few more subgroups and using the visual techniques introduced here to determine which are normal. A classic example is to compare two subgroups in S3, the subgroup generated by (1 2) and the subgroup generated by (0 1 2).
Group Visualization with [i]Group Explorer[/i] - Quotient Groups in Multiplication Tables

Figure 19. Multiplication table of A4 showing the quotient by V4
If we tried the same thing with a non-normal subgroup, say the subgroup generated by the permutation (0 1 2), we would get something like Figure 20. It is clear from the lack of order in Figure 20 that there is a significant difference as compared to Figure 19. One cannot step back and mentally cluster Figure 20 by color and expect to obtain a valid multiplication table for a group of order 4; the colors are too mixed to permit this.

Figure 20. Multiplication table of A4 organized by a non-normal subgroup
Group Visualization with [i]Group Explorer[/i] - Conclusion
Group Explorer can be used to demonstrate a variety of topics in group theory. We have just seen how to visualize normal subgroups and quotient groups. But Cayley diagrams can be used for much more. We briefly mentioned how to see the difference between abelian and non-abelian groups, or between cyclic and non-cyclic groups. Although we did not introduce the Permutation View, you can use it to study topics such as the left-regular representation of elements of a group. For more ideas, see the partial list of assignment and lesson ideas on the homework assignment page (Link is obsolete, ed. 2014) on the Group Explorer Web site. Contact one of us to include your own ideas on the Web site.
Group Visualization with [i]Group Explorer[/i] - References
Fraleigh, John (2002). A First Course in Abstract Algebra, 7th edition. Addison-Wesley.
Gallian, Joseph (2006). Contemporary Abstract Algebra, 6th edition. Houghton Mifflin.
GAP (2004). GAP -- Groups, Algorithms, Programming -- a System for Computational Discrete Algebra, software available online at http://www.gap-system.org (accessed 12/26/05)
Grossman, Israel, & Magnus, Wilhelm (1975). Groups and Their Graphs. Mathematical Association of America, New Mathematical Library #14
Hibbard, Allen, & Levasseur, Kenneth (1999). Exploring Abstract Algebra with Mathematica. TELOS/Springer Verlag
Hibbard, Allen, & Levasseur, Kenneth (2002). Exploring Abstract Algebra with Mathematica, Web site to support the EAAM textbook and provide the AbstractAlgebra software, available at http://www.central.edu/eaam/ (accessed 12/26/05)
Hibbard, Allen, & Maycock, Ellen (2002). Innovations in Teaching Abstract Algebra. Mathematical Association of America, MAA Notes #60
Magma (2005). The Magma Computational Algebra System, software available online at http://magma.maths.usyd.edu.au (accessed 12/26/05)
Webb, Bayard, & Keppelmann, Edward (2004). Finite Group Behavior. Software available online at http://unr.edu/homepage/keppelma/fgb.html (accessed 12/26/05)