Group Visualization with [i]Group Explorer[/i] - In the Classroom: A Subgroup Example
Group Explorer can be used in a variety of ways to enhance understanding in the abstract algebra classroom. We have already mentioned some basics -- for instance, how a Cayley diagram can be used to see whether a group is abelian. But some of the more difficult concepts that come up early in abstract algebra studies can be illustrated as well.
Consider, for instance, normal subgroups and quotient groups and how these concepts relate. On this page and the next, we describe a demonstration with the dynamic nature of Group Explorer that can help us see what a quotient group is. We will walk through all of the steps that manipulate an ordinary Cayley diagram of the group A4 into a more useful diagram for visualizing the quotient of A4 by a subgroup isomorphic to V4, the Klein 4-group, which is isomorphic to Z2 x Z2. We proceed as if you are following along using Group Explorer. But, because each step is illustrated, you can also follow along without having the software at all.
Note: We consistently use the term "quotient group", which is synonymous with "factor group".
We assume that you have heard of normal subgroups before, and our aim is illustrate them, to give you some visual intuition to associate with this concept. As a quick refresher, normal subgroups are those subgroups that allow you to form a quotient group; that is, H is a normal subgroup of G just when you can form a quotient group G/H.
If you are an instructor considering using this tutorial in class, you might want to ensure that your students know that A4 has a normal subgroup isomorphic to V4. In fact, you may get your students to discover this by assigning them the task of drawing a subgroup lattice for A4, and identifying which subgroups are normal. The "highlight" feature of Group Explorer's views can be used by students to help them find and identify (normal) subgroups.
Viewing and Rearranging a Diagram of A4
Begin by opening the rectangular Cayley diagram for A4: Use the Open command from the File menu to open the group A4. From the Group menu, choose Create Cayley diagram, and then rectangular. Your diagram should look like Figure 8. This diagram is not particularly attractive -- we have asked Group Explorer to arrange the nodes in a rectangle because we intend to manipulate this diagram to suit our needs in the steps to come.

Figure 8. Default rectangular Cayley diagram for A4
We want to manipulate this diagram to organize it around the subgroup isomorphic to V4. Right-click on the Cayley diagram and choose Edit diagram to bring up an edit window. Using the Define H and a tab on that window, add the elements (0 1)(2 3) and (0 2)(1 3) to the subgroup H. These two elements generate the subgroup isomorphic to the Klein 4-group V4. The portion of your Edit Cayley Diagram window that corresponds to the definition of H will look like Figure 9.

Figure 9. Editing the diagram to show an order-4 subgroup
 |
Figure 10. Highlighting
|
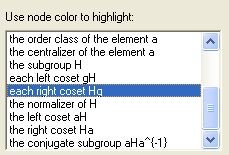
Now switch over to the Highlight tab so that we can make use of the subgroup H we have defined. Under Use node color to highlight, choose each right coset Hg, as shown in Figure 10. When you click Apply, your diagram will be partitioned into three distinct classes by color, each color representing a right coset Hg of the subgroup H in A4. Your diagram should look like Figure 11, which shows us how the group is partitioned by the right cosets of H. This colorization is accurate, but it does not yet help exhibit the structure of the group with respect to these cosets. We therefore ask Group Explorer to rearrange the diagram according to our colorization.

Figure 11. Cosets highlighted, but arrangement unchanged
To reorganize the diagram by cosets, so that things of like color will be grouped together, go to the Axes & Priority tab and click the Organize diagram by H button. Your grid of generators, priorities, and axes, should then look like Figure 12. When you click Apply, your diagram will be modified to look like the three-dimensional shape in Figure 13.

Figure 12. Generators organized to respect cosets

Figure 13. Diagram organized by cosets
This arrangement of generators, priorities, and axes is Group Explorer's best guess as to what would be best suited for the eye. However, things are still a bit difficult to see here, even though some order is apparent. But if we spin this shape a bit to the right, we can line up in our view the yellow, blue, and green nodes in columns, as in Figure 14.

Figure 14. Clearer view of the order in Figure 13
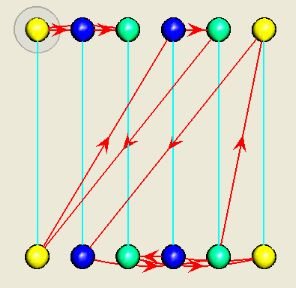
Now we choose a different assignment of axes so that we can see the quotient group structure more clearly. On the Axes & Priority tab of the Edit Cayley Diagram box, go to the drop-down list next to the Change all axes to: button and choose the Ring of rectangles item. Click the Change all axes to: button to have this choice impact the axes in the grid. When you click Apply, your diagram will then look like Figure 15. Not only can we now see how the group is partitioned into cosets, but we also begin to see some of the interaction among these cosets.
