- About MAA
- Membership
- MAA Publications
- Periodicals
- Blogs
- MAA Book Series
- MAA Press (an imprint of the AMS)
- MAA Notes
- MAA Reviews
- Mathematical Communication
- Information for Libraries
- Author Resources
- Advertise with MAA
- Meetings
- Competitions
- Programs
- Communities
- MAA Sections
- SIGMAA
- MAA Connect
- Students
- MAA Awards
- Awards Booklets
- Writing Awards
- Teaching Awards
- Service Awards
- Research Awards
- Lecture Awards
- Putnam Competition Individual and Team Winners
- D. E. Shaw Group AMC 8 Awards & Certificates
- Maryam Mirzakhani AMC 10 A Awards & Certificates
- Two Sigma AMC 10 B Awards & Certificates
- Jane Street AMC 12 A Awards & Certificates
- Akamai AMC 12 B Awards & Certificates
- High School Teachers
- News
You are here
A Framework for Technology-Rich Explorations - Illustration of the Framework 3
Level 3: Function Model
Students employing function model strategies have a stronger understanding of function and curve fitting. Students with a background of the Pythagorean Theorem may set up a function that describes the total length of rope. Denoting the horizontal distance between the two poles as w and the height of the poles as n and 2n, total rope length may be expressed as ![]() . We illustrate this approach in Figure 9.
. We illustrate this approach in Figure 9.
Figure 9. Students with knowledge of functions and the Pythagorean Theorem
may express total rope length as a function of QR.
As Figure 10(a) suggests, the algebraic expression for rope length may be typed into the y= editor of a graphing calculator for further examination. Because rope length is defined generally, in terms of parameters n (length of pole PQ) and w (distance between the poles), students may investigate the function for various pole heights and distances by entering values into parameters N and W from the calculator home screen -- see Figure 10(b).

Figure 10. (a) Function for total rope length as it appears in the TI-83+ y= editor;
(b) Students may assign values to parameters N and W with the Store command.
After setting up reasonable display dimensions, students graph the total length function for their selected values of n and w. They can then use the minimization feature of their calculator to find minimal rope length, as illustrated in Figure 11.
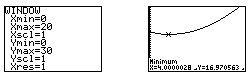
Figure 11. (a) Window settings for total rope length function;
(b) Plot of rope length with respect to length of segment QR (i.e. x).
Rope length appears to be minimized when QR = 4 cm.
To provide all students with an opportunity to experience the function analysis, we give different teams or individuals different values of n and w. From their home screens, our students change the values of the parameters and then find the minimum rope length for their particular values. In a class of 20 students, enough data may be collected to look for relationships among n, w, and minimal rope length. In Figure 12, we provide a table of minimal rope lengths for several different (n, w) pairs.
|
n (height of pole PQ) |
w (distance between poles) |
QR (i.e. x) corresponding to minimal rope length |
|
5 |
12 |
4 cm |
|
6 |
12 |
4 cm |
|
7 |
12 |
4 cm |
|
8 |
12 |
4 cm |
|
2 |
15 |
5 cm |
|
3 |
15 |
5 cm |
|
5 |
15 |
5 cm |
|
7 |
15 |
5 cm |
|
4 |
21 |
7 cm |
|
17 |
21 |
7 cm |
|
21 |
21 |
7 cm |
Figure 12. Values of x that minimize rope lengths for several pairs of n and w
As one might suspect, students quickly conjecture that the value of n (i.e., height of the pole PQ) does not affect minimal rope length. Rather, it appears that minimal rope length is precisely w/3 (i.e., one third of the distance between the poles). Using basic trigonometric ratios and the fact that tan x is a 1-1 function on [0, p/2), students recognize that total rope length is minimized when angles PRQ and TRS have the same measure, as illustrated in Figure 13.

Figure 13. Students may use their knowledge of trigonometric functions
to hypothesize that total rope length is minimized
when angles PRQ and TRS have the same measure.
Recent textbooks (e.g., Larson, et al., 1998) use technology to strengthen students' knowledge of families of continuous functions. In addition to "synthetic" models using the Pythagorean Theorem or trigonometric relationships, students may use calculator-based regression with collected data to construct non-linear models. Our students use models such as these to better interpret the data and make predictions as they attempt to find one that suitably describes the collected data. We highlight such an approach on the next page.
Antonio Quesada and Michael Todd Edwards, "A Framework for Technology-Rich Explorations - Illustration of the Framework 3," Convergence (July 2005)


