- About MAA
- Membership
- MAA Publications
- Periodicals
- Blogs
- MAA Book Series
- MAA Press (an imprint of the AMS)
- MAA Notes
- MAA Reviews
- Mathematical Communication
- Information for Libraries
- Author Resources
- Advertise with MAA
- Meetings
- Competitions
- Programs
- Communities
- MAA Sections
- SIGMAA
- MAA Connect
- Students
- MAA Awards
- Awards Booklets
- Writing Awards
- Teaching Awards
- Service Awards
- Research Awards
- Lecture Awards
- Putnam Competition Individual and Team Winners
- D. E. Shaw Group AMC 8 Awards & Certificates
- Maryam Mirzakhani AMC 10 A Awards & Certificates
- Two Sigma AMC 10 B Awards & Certificates
- Jane Street AMC 12 A Awards & Certificates
- Akamai AMC 12 B Awards & Certificates
- High School Teachers
- News
You are here
Classroom-Ready Data Sets in Environmental Math - A Student Project
Multi-day projects involving real data allow students to investigate applied topics in depth. By incorporating many facets of data analysis (evaluating data validity, identifying outliers, describing patterns, drawing conclusions, etc.), projects help students develop both basic quantitative skills and higher-level critical thinking abilities.
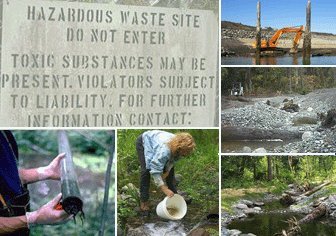 One of the extended projects that we use in our interdisciplinary mathematics and environmental science course links the mathematics of normal distributions with the science of hazardous waste. Students are presented with hazardous waste production data from the U.S. Environmental Protection Agency's Biennial Reporting System, the only nationwide, uniform database on hazardous waste generation and management. Hazardous materials, such as lead and toluene, are categorized and monitored under the Resource Conservation and Recovery Act (RCRA). See Background Information on Hazardous Waste.
Data for the hazardous waste project can be found at the QELP web site as Data Set #003, a compilation from 12 states for the years 1989-1997. In our course, we prefer that each group work with a different data set, and so the compiled data are broken down by state. The state-by-state data (in Excel format only) are found in the About the Data section of Data Set #003. We present each group with a data sheet (click here to see the data sheet for Illinois) that lists county population and biennial RCRA data. Our students use a graphing calculator (the TI-83 Plus), so we download the data to their calculators. For courses using spreadsheet or statistical software, we recommend that students download state data directly from the QELP web site, and then create and print their own data sheets.
In the project, we first ask students to note any unusually large changes in RCRA waste production from biennium to biennium. RCRA waste production in each county often varies over several orders of magnitude. Students calculate the mean RCRA waste production over an 8-year period for each of the counties and observe that the county mean RCRA values are fairly skewed. Students progressively work toward obtaining normally distributed data by computing per capita waste production and then transforming the per capita data using logarithms. Students are also questioned about a proposed enforcement/regulatory scheme ("carrots and sticks"). The enforcement rubric creates a utilitarian aspect to the mathematical analysis at several steps in the project. Students generate increasingly more sophisticated punishment and reward schemes, including one based on z-scores.
A slightly condensed version of the project can be viewed here: Hazardous Waste Project (HTML). The complete project, with background information and state data sheets, can be downloaded as a Word document here: Hazardous Waste Project (Word).
Source for photos on this page: EPA Cleanup Enforcement Site
Greg Langkamp and Joe Hull, "Classroom-Ready Data Sets in Environmental Math - A Student Project," Convergence (December 2004)


