- About MAA
- Membership
- MAA Publications
- Periodicals
- Blogs
- MAA Book Series
- MAA Press (an imprint of the AMS)
- MAA Notes
- MAA Reviews
- Mathematical Communication
- Information for Libraries
- Author Resources
- Advertise with MAA
- Meetings
- Competitions
- Programs
- Communities
- MAA Sections
- SIGMAA
- MAA Connect
- Students
- MAA Awards
- Awards Booklets
- Writing Awards
- Teaching Awards
- Service Awards
- Research Awards
- Lecture Awards
- Putnam Competition Individual and Team Winners
- D. E. Shaw Group AMC 8 Awards & Certificates
- Maryam Mirzakhani AMC 10 A Awards & Certificates
- Two Sigma AMC 10 B Awards & Certificates
- Jane Street AMC 12 A Awards & Certificates
- Akamai AMC 12 B Awards & Certificates
- High School Teachers
- News
You are here
Classroom-Ready Data Sets in Environmental Math - An Extended Problem
Data sets can also serve as the basis for more involved student assignments, including extended homework problems and full-day classroom activities. Here is a problem that can be used in a precalculus and trigonometry course. The data analysis can be done using WebStat, a graphing calculator, or spreadsheet software.
Atmospheric Carbon Dioxide at the Mauna Loa Observatory, 1974-1985
|
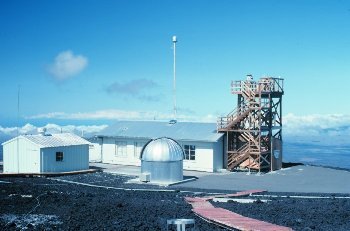 The Mauna Loa Observatory with view of the dome housing Dobson ozone spectrophotometer and air intake tower for atmospheric constituent measurements. Source: NOAA Photo Library |
-
Estimate the period and amplitude of the de-trended data. Then describe the de-trended data with either a sine or cosine function.
-
Make a plot of the residuals (i.e. differences) between the de-trended data and your trigonometric function found in part 4. Are the de-trended data perfectly sinusoidal? Explain.
-
Determine a function that describes the original data set (before de-trending).
- Read the background information on the Mauna Loa CO2 data (see About the Data). Describe how the data would be different if the Mauna Loa observatory were located in the southern hemisphere. How could you modify your functions from parts 4 and 6 so that they would fit southern hemisphere data?
Greg Langkamp and Joe Hull, "Classroom-Ready Data Sets in Environmental Math - An Extended Problem," Convergence (December 2004)


