- About MAA
- Membership
- MAA Publications
- Periodicals
- Blogs
- MAA Book Series
- MAA Press (an imprint of the AMS)
- MAA Notes
- MAA Reviews
- Mathematical Communication
- Information for Libraries
- Author Resources
- Advertise with MAA
- Meetings
- Competitions
- Programs
- Communities
- MAA Sections
- SIGMAA
- MAA Connect
- Students
- MAA Awards
- Awards Booklets
- Writing Awards
- Teaching Awards
- Service Awards
- Research Awards
- Lecture Awards
- Putnam Competition Individual and Team Winners
- D. E. Shaw Group AMC 8 Awards & Certificates
- Maryam Mirzakhani AMC 10 A Awards & Certificates
- Two Sigma AMC 10 B Awards & Certificates
- Jane Street AMC 12 A Awards & Certificates
- Akamai AMC 12 B Awards & Certificates
- High School Teachers
- News
You are here
Designing Attribute Acceptance Sampling Plans - Approximation of the Hypergeometric Distribution by Binomial Distributions
The approximation of Hypergeometric distributions by Binomial distributions can be proved mathematically, but one can also observe the concept by using the Spin Button (available in Excel 95 or above), which involves nothing more than "click" and "drag-and-drop". If you need instructions for using this feature, click here.
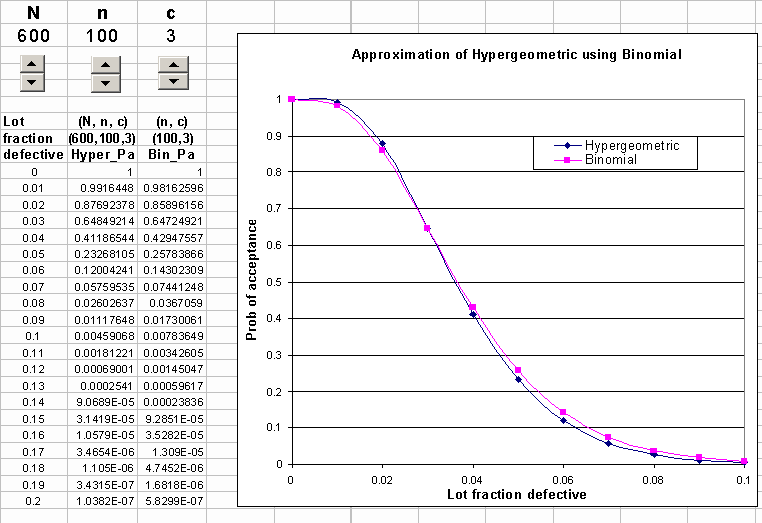
The following figure shows a spreadsheet in which the Hypergeometric distribution is used to calculate the probability of acceptance for any plan (N, n, c), whereas the Binomial distribution is used for any plan (n, c), with the assumption that N is large enough to justify the approximation. You can click on the chart to get to the Excel environment -- also click "NO" to keep the existing information. When you click the Spin Button for n or c, the two OC curves change accordingly. However, when you click the Spin Button for N, only the OC curve plotted with the Hypergeometric probabilities will move.
When n or N increases, the slopes of the OC curves become steeper gradually. However, the sample size n has a much greater effect on the OC curve than the lot size N. In fact, when the ratio![]() is small, the lot size N has almost no effect on the OC curve. In other words, when the ratio
is small, the lot size N has almost no effect on the OC curve. In other words, when the ratio![]() is small, Hypergeometric distributions can well be approximated by Binomial distributions. For this reason, when the lot size N is large in comparison with the sample size n, the sampling plan (N, n, c) can be replaced by (n, c) without affecting the OC curve much. The acceptance number c has a much greater effect on the OC curve than the sample size n and the lot size N.
is small, Hypergeometric distributions can well be approximated by Binomial distributions. For this reason, when the lot size N is large in comparison with the sample size n, the sampling plan (N, n, c) can be replaced by (n, c) without affecting the OC curve much. The acceptance number c has a much greater effect on the OC curve than the sample size n and the lot size N.
There is a problem with calculating the exact probability Pa of lot acceptance in Excel because the Hypergeometric distribution does not have a "cumulative" flag. On the other hand, using the Binomial distribution is convenient because it has this flag. Lacking a "cumulative" flag for the Hypergeometric function, I have done something special to handle this situation. For each level of fraction defective from 0.01 to 0.2, I create a row of Hypergeometric probabilities for each c from 0 to 6. For this reason, the maximum limit of the Spin Button for c has been set to 6. The table of Hypergeometric probabilities hides behind the chart in the spreadsheet. Then I use the Excel function IF (logical_test, value_if_true, value_if_false) to produce the cumulative Hypergeometric probability when c is greater than 0. For instance, when the fraction defective is at 0.01 and c = 2, the value_if_true is SUM(E11..G11), which is the cumulative Hypergeometric probability.
Steve H. K. Ng, "Designing Attribute Acceptance Sampling Plans - Approximation of the Hypergeometric Distribution by Binomial Distributions," Convergence (October 2004)


