- About MAA
- Membership
- MAA Publications
- Periodicals
- Blogs
- MAA Book Series
- MAA Press (an imprint of the AMS)
- MAA Notes
- MAA Reviews
- Mathematical Communication
- Information for Libraries
- Author Resources
- Advertise with MAA
- Meetings
- Competitions
- Programs
- Communities
- MAA Sections
- SIGMAA
- MAA Connect
- Students
- MAA Awards
- Awards Booklets
- Writing Awards
- Teaching Awards
- Service Awards
- Research Awards
- Lecture Awards
- Putnam Competition Individual and Team Winners
- D. E. Shaw Group AMC 8 Awards & Certificates
- Maryam Mirzakhani AMC 10 A Awards & Certificates
- Two Sigma AMC 10 B Awards & Certificates
- Jane Street AMC 12 A Awards & Certificates
- Akamai AMC 12 B Awards & Certificates
- High School Teachers
- News
You are here
Group Visualization with Group Explorer - Exhibiting Quotient Group Structure
On the Arrows & Chunking tab of the Edit Cayley Diagram window, check the box for Chunk right cosets of H, and then check the box for Align heads of arrows between right cosets of H as shown in Figure 16. When you click Apply, your diagram will look like Figure 17. At this point we are done manipulating the diagram.
Compare this to the diagram we get when we apply the same process to the diagram using the subgroup H = <(1 3 2)>. Go back to the Define H and a tab, remove the generators (0 1) (2 3) and (0 2) (1 3), and add the generator (1 3 2). Now go to the Axes and Priority tab and click on the Organize diagram by H button. When you change the axes to the polar form, the Cayley diagram should look like Figure 18.

Figure 16. Check boxes for chunking the diagram
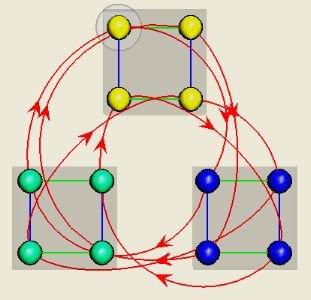
Figure 17. The quotient group of A4 by V4
Group Explorer has done two things here that make Figure 17 extremely helpful for visualizing the quotient group. First, it put translucent gray boxes around the cosets of H so that you can more easily think of them as single units, which is the first step in understanding a quotient group. Second, it brought the arrowheads on the red arrows near to one another so that they cluster nicely. This demonstrates that the red generator operates uniformly on each coset.
At this stage you can see that the red arrows that leave the top coset (the four yellow nodes) all move to the (blue) coset at the right. That is, the red arrows take the four yellow nodes to the four blue nodes. Similarly, they take the blue coset to the green coset, and then the green coset back to the yellow coset.
Now you can see the quotient group A4/V4 by mentally taking a few steps back from the image in Figure 17, viewing each coset as a unit and each bundle of arrows as a single arrow. There are three cosets and the bundles of arrows march through the cosets in a cyclic fashion. So we can see that the quotient group is isomorphic to the cyclic group Z3.
|
|
Figure 18. Organization by a
|
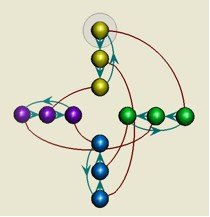
Here we notice that the right cosets are grouped together as before. However, the red edges do not move uniformly from one coset to another, but rather they head off in different directions. For example, if we follow the red arrow from the top element of the yellow coset, we end up at the green coset. If we follow it from the middle element of the yellow coset, we end up at the blue coset. And if we follow the red arrow from the bottom element, we end up at the purple coset. This demonstrates a fundamental feature of normal subgroups: the operation on cosets is well-defined if and only if the subgroup is normal.
Instructors will appreciate how the dynamic nature of Group Explorer can help students gain a fuller appreciation of a concept in just a few minutes of class time that would take significantly longer without the software. On your own, consider inspecting a few more subgroups and using the visual techniques introduced here to determine which are normal. A classic example is to compare two subgroups in S3, the subgroup generated by (1 2) and the subgroup generated by (0 1 2).
Nathan Carter and Brad Emmons, "Group Visualization with [i]Group Explorer[/i] - Exhibiting Quotient Group Structure," Convergence (December 2005)


