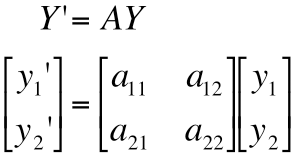
This page enables you to investigate linear systems of differential equations of the form

Type the entries of the matrix A below.
The graph on the left (with a blue background) shows the phase plane. The graph on the right (with a green background) shows the variables x1 and x2 as functions of time. The initial values are indicated by a red square on the phase plane and along the vertical axis on the right graph. You can change the initial position by clicking on the phase plane or on the arrows above the phase plane and to the right of the phase plane.
You can focus on a particular time by clicking on the right graph (with a green background). The time you have chosen is indicated by a vertical line on this graph and by a black dot on the phase plane.