| Object | Formatting |
|---|---|
| Graph of y = f(x) | 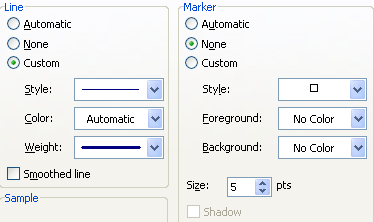 |
| Point (x0, y0) | 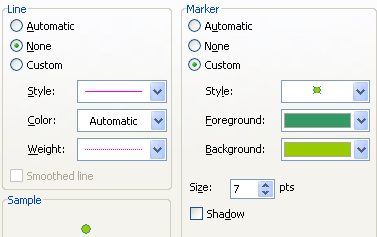 |
| Tangent line y = y0 + f '(x0)(x − x0) | 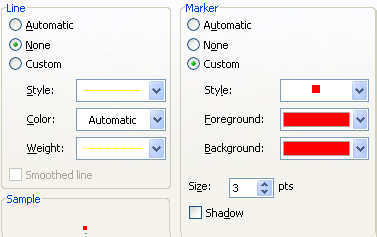 |
| Horizontal line y = y0 | 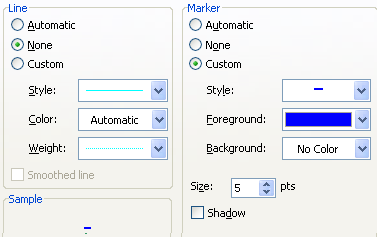 |
| Vertical line x = x0 | 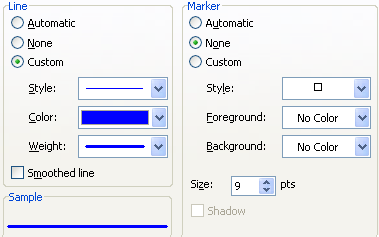 |
The table below shows the formatting of the data series for each of the 5 objects in the Tangent Line mathlet. Double-click on the object and choose the Patterns Tab to get the dialog box.
| Object | Formatting |
|---|---|
| Graph of y = f(x) |  |
| Point (x0, y0) |  |
| Tangent line y = y0 + f '(x0)(x − x0) |  |
| Horizontal line y = y0 |  |
| Vertical line x = x0 |  |