Intuiting Mathematical Objects using Kinetigrams
Teachers of mathematics have no consensus on answers to the questions: "What is mathematics?" and "How do you do it?" Too much emphasis has been placed on trying to answer the first, and not enough on addressing the second independently of the first.
I have been developing a modeling approach to teaching calculus that emphasizes exploratory problem solving and visualization. In the process, I have developed several modeling situations that I will use in here to illustrate my ideas. These modeling situations are convenient fictions, and the degree to which they faithfully capture the processes they purport to model is not my point here.
Acknowledgements
This is a revised and expanded version of an article that appeared in the TALUM Newsletter Number 10, published by the Teaching and Learning Undergraduate Mathematics subcommittee of the Teaching Committee of the Mathematical Association of Great Britain, and edited by Dr. R. P. Burn.
I thank Bob Burn and Phillip Kent for several insightful and very helpful suggestions on previous versions of this article.
Published July 2001
© 2001 by John Pais. All rights reserved.
Intuiting Mathematical Objects using Kinetigrams - Abstract
Teachers of mathematics have no consensus on answers to the questions: "What is mathematics?" and "How do you do it?" Too much emphasis has been placed on trying to answer the first, and not enough on addressing the second independently of the first.
I have been developing a modeling approach to teaching calculus that emphasizes exploratory problem solving and visualization. In the process, I have developed several modeling situations that I will use in here to illustrate my ideas. These modeling situations are convenient fictions, and the degree to which they faithfully capture the processes they purport to model is not my point here.
Acknowledgements
This is a revised and expanded version of an article that appeared in the TALUM Newsletter Number 10, published by the Teaching and Learning Undergraduate Mathematics subcommittee of the Teaching Committee of the Mathematical Association of Great Britain, and edited by Dr. R. P. Burn.
I thank Bob Burn and Phillip Kent for several insightful and very helpful suggestions on previous versions of this article.
Published July 2001
© 2001 by John Pais. All rights reserved.
Intuiting Mathematical Objects using Kinetigrams - Philosophical Background: Doing Mathematics
Teachers of mathematics first and foremost want their students to learn how to do mathematics. However, there is no unanimity on answers to the questions: "What is mathematics?" and "How do you do it?" Perhaps too much emphasis has been placed on trying to answer the first, and not enough on addressing the second independently of an achieved consensus on the first. Quine (1981, pages 148-150) comments on Russell's witty, though extreme, answer to the first question:
|
There has been a perverse tendency to think of mathematics primarily as abstract or uninterpreted and only secondarily as interpreted or applied, and then to philosophize about application. This was the attitude of Russell at the turn of the century, when he wrote that in pure mathematics "we never know what we are talking about, nor whether what we are saying is true." …This disinterpretation of mathematics was a response to non-Euclidean geometry. Geometries came to be seen as a family of uninterpreted systems… I find this attitude perverse [both in geometry and in arithmetic]. The words 'five' and 'twelve' are at no point uninterpreted; they are as integral to our interpreted language as the word 'apple' itself. They name two intangible objects, numbers, which are sizes of sets of apples and the like… The expressions 'five', 'twelve', and 'five plus twelve' differ from 'apple' in not denoting bodies, but this is no cause for disinterpretation; the same can be said of such unmathematical terms as 'nation' or 'species'. Ordinary interpreted scientific discourse is as irredeemably committed to abstract objects--to nations, species, numbers, functions, sets--as it is to apples and other bodies. |
Mathematical objects are abstract, in that we can posit them and reason about their properties and derivative objects, unencumbered by the necessity of their having any physical attributes. Generally, as indicated by Quine, a mathematical theory has an intended interpretation that guides the development of the theory and, as such, is intrinsic to an understanding of the theory and its intended mathematical objects. With this in mind, doing mathematics is not just an analytic process of proving theorems but an interplay between the analytic process and an intuitive unfolding of the mathematical objects one is trying to develop. So, doing mathematics is an heuristic process and it is this notion of 'doing' that we should try to communicate to our students. First and foremost, in order for mathematics to make sense, students need to learn how to intuit mathematical objects on their own.
I will now briefly discuss some recent related work. The best contemporary account of a realist philosophy of mathematics, in terms of clarity, coherence, and completeness, is Resnik (1997). In particular, he presents a lucid account of mathematical objects as posits. Though he ultimately argues for mathematical objects as positions in patterns, his primary discussion of mathematical objects does not depend on this interpretation. The following is from his introduction to Chapter 9. Positing Mathematical Objects, pages 175-176:
|
…[I]n so far as realists maintain that mathematical objects are causally inert and outside space-time, they should explain how we can attain mathematical knowledge using just our ordinary faculties. I will now attempt to meet this challenge through a postulational account of the genesis of our mathematical knowledge. The basic idea is that humans brought mathematical objects into their ken by positing them. Now to posit a new kind of object one need only introduce a new predicate P (or, as happens frequently, begin to use an old one with a new sense) and claim that P exists. Thus, it is plain that realists who claim that mathematical objects are posits invite a variety of worries and objections. Postulational approaches seem better suited to conventionalists, who may claim that we make truths, than to realists, who must hold that we can only recognize independently obtaining truths. Below I will explain why positing is not incompatible with realism, I will distinguish positing in mathematics from the creative efforts of fiction writers, and, finally, I will explain how in positing mathematical objects we manage to refer to them. I will be assuming that in providing an epistemology for mathematics, realists are entitled to assume that we already have an abundant fund of knowledge of mathematical objects… The problem, then, is to explain how we have obtained the knowledge of mathematical objects we now have. |
Hersh (1997) does not seriously address traditional philosophy of mathematics, but many of his observations on doing mathematics provide valuable insights for teachers of mathematics. Specifically, some of his observations concerning mathematical intuition are quite interesting and helpful, e.g. pages 65-66:
|
Accounting for intuitive "knowledge" in mathematics is the basic problem of mathematical epistemology. What do we believe, and why do we believe it? To answer this question we ask another question: what do we teach, and how do we teach it? Or what do we try to teach, and how do we find it necessary to teach it? We try to teach mathematical concepts, not formally (memorizing definitions) but intuitively--by examples, problems, developing an ability to think, which is the expression of having successfully internalized something. What? An intuitive mathematical idea… We have intuition because we have mental representations of mathematical objects. We acquire these representations, not mainly by memorizing formulas, but by repeated experiences (on the elementary level, experience of manipulating physical objects; on the advanced level, experiences of doing problems and discovering things for ourselves)… Different people's representations are always being rubbed against each other to make sure they're congruent… The point is that as shared concepts, as mutually congruent mental representations, they're real objects whose existence is just as "objective" as mother love and race prejudice, as the price of tea or the fear of God. How do we distinguish mathematics from other humanistic studies?… Those subjects that have reproducible results are called natural sciences. In the realm of ideas, of mental objects, those ideas whose properties are reproducible are called mathematical objects, and the study of mental objects with reproducible properties is called mathematics. Intuition is the faculty by which we consider or examine these internal, mental objects. |
Tieszen (1998) argues for the essential, in-eliminable role of mathematical intuition in doing mathematics and in making fundamental mathematical progress, tracing these ideas to their roots in the work of Husserl and Gödel.
Thurston's (1994) thoughtful and thought provoking article charges mathematicians and mathematics teachers to spend more energy focusing their talents on communicating how mathematics is actually done, e.g. page 168:
|
We mathematicians need to put far greater effort into communicating mathematical ideas. To accomplish this, we need to pay much more attention to communicating not just our definitions, theorems, and proofs, but also our ways of thinking. We need to appreciate the value of different ways of thinking about [intuiting] the same mathematical structure. We need to focus far more energy on understanding and explaining the basic mental infrastructure of mathematics… This entails developing mathematical language that is effective for the radical purpose of conveying ideas to people who don't already know them. |
How does one come to know and understand the nature of the intended objects a mathematical theory is about? Often when this problem is addressed in a specific course, the instructor is too close to the mathematics, in the sense that it is an automatic, finely-tuned component of his/her own intellectual machinery. This difficulty in attaining sufficient distance from the subject matter can prevent the instructor from detecting and appreciating the various features of the planned learning experience that may render the mathematical material quite strange and unfamiliar, even alien, to the beginner.
In (Pais, in preparation) I try to illustrate how narrow this communication channel can be in a theory that is intentionally presented in a such a way as to obscure or neutralize the actual intended interpretation. (Possibly this simulates a situation not unlike rigorously presenting the real number system to someone who doesn't already know it and its jargon.) I then present a revised version of the same theory in which the mathematical language is carefully chosen to communicate the intended interpretation, together with the use of visual language, diagrams and kinetigrams, to help the reader unfold his/her intuition of the intended mathematical objects. In the remainder of the present paper I will briefly show how visual representations using diagrams and kinetigrams can play an essential role in intuiting some mathematical objects that can be used to model some pharmacokinetic processes.
Intuiting Mathematical Objects using Kinetigrams - Kinetigrams: Dissolution
Over the past five years I have been developing a modeling approach to teaching calculus (Pais, 1997-2001), which emphasizes exploratory problem solving and visualization, and which refocuses and reprioritizes the learning goals of a traditional calculus course to ensure that the course content will be both appealing and useful to pharmacy students. In the process, I have developed several pharmacokinetic modeling situations that I will use in this paper simply because they are close at hand and permit fairly rapid development of the computer graphics that I need to illustrate my ideas. I thank you, my reader, for your indulgence and, since this application context will most likely seem unfamiliar, I ask you to pick the mathematics out of the given context and try to think about how you might do something similar in your own setting. Further, bear in mind that these modeling situations are convenient fictions, and the degree to which they faithfully capture the processes they purport to model is not at issue here.
Here is a clear introductory description of pharmacokinetics from Spitznagel (1992):
|
Pharmacokinetics is the study of the movement of drugs through the human system, from their introduction by ingestion, injection, or other means, to elimination through excretion or metabolism. It makes heavy use of compartment models as found in many differential equations textbooks. Since almost all students take medications from time to time, pharmacokinetics models are something they can easily relate to. For convenience many drugs are taken orally in the form of tablets. With some exceptions, these tablets [dosage forms] are designed to swell and disintegrate rapidly [release], causing the medication to dissolve quickly in the gastrointestinal tract [dissolution]. From there, the medication passes into the bloodstream [absorption], which delivers it to the sites at which it has therapeutic effect. Typically, the drug is removed from the bloodstream by filtration through the kidneys [excretion] or by metabolism in the liver. |
The primary mathematical objects that we will be concerned with are real-valued functions defined on some closed interval [0, a], which will be introduced in the context of modeling the dissolution, absorption, and excretion processes. The displayed argument of each such function will be t, to indicate the time-dependent nature of the process that is being modeled. My main purpose in this section of the paper is to assess some alternative approaches to defining these functions, in terms of Thurston's notion of an effective mathematical communication.
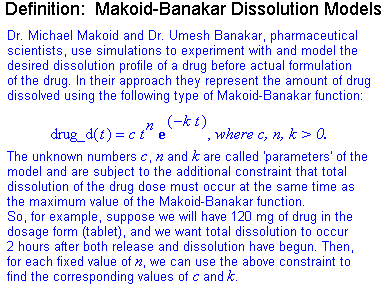
I first distinguish two basic types of definitions: analytic and intuitive. The box below shows an example of the first type. In this context 'dissolution profile' means the shape of the graph of the dissolution function, and 'formulation' means chemical formulation of the drug in dosage form. Also, 'drug dose' refers to the total quantity of medication present in the dosage form (tablet), measured in milligrams. The aim of this definition is to model only the dissolution process occurring in the gastrointestinal (GI) tract, and hence it does not address absorption into the bloodstream.
.
|
The analytically oriented definition above provides a mathematically precise description, but at this point it provides no intuitive insight into the mathematical objects that it purports to describe, except possibly for those mathematicians who are familiar with how this class of functions looks. So, in a standard development one would next present some specific examples. Here, without all the details, are two examples. In the first one, we let n = 1 and assume our drug dose is 120 mg with a desired time to complete dissolution of 2 hrs. In the second one, this last assumption is the same, but we begin with n = 2.
.
|
For our immediate purposes in this paper, a (mathematical) 'diagram' is an heuristic, 2D, finite, partial representation of mathematical objects, containing both visual (graphical) and analytic (linguistic) components, and organized in such a way as to readily convey information about the new mathematical objects we are trying to develop. Moreover, this conception of diagram provides a crucial intuitive interface to mathematical objects as abstract objects discussed in section 1 of this paper. In each diagram example, above and below, we see both the shape of a Makoid-Banakar function and its corresponding analytic description, together with other pertinent information that can be immediately extracted from each diagram, e.g. the constraint that 120 mg of the drug is dissolved in 2 hrs at the same time as the maximum value of the Makoid-Banakar function, a comparison with uniform dissolution at a rate of 60 mg/hr (the purple line), and the percentage of drug dissolved in the first half hour.
.
|
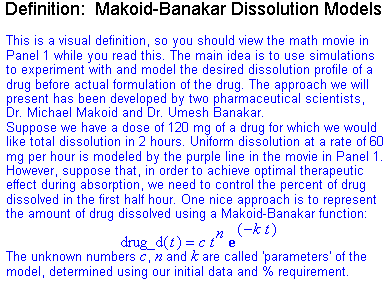
Our Analytic Definition 1, as is usual with analytically oriented definitions, has as its primary purpose to provide a clear and precise analytic specification using minimal language that is designed to reveal exactly what will be needed in the statement and proof of anticipated theorems. In contrast, our Diagram Examples 1 and 2 are designed to provide the beginning of an intuitive unfolding of the mathematical objects specified by the analytic definition, namely, Makoid-Banakar functions. So, to emphasize the intuitive development over the analytic, we might consider reversing the order of presentation, but this too is not quite what we want. However, if we reflect on Thurston's suggestion that we should try to develop "mathematical language that is effective for the radical purpose of conveying ideas to people who don't already know them," then the notion of some sort of hybrid presentation emerges. I have been experimenting with a hybrid presentation that I call a 'kinetigram definition'. A 'kinetigram' is simply a diagram that changes. Below is an example of a kinetigram definition for Makoid-Banakar functions that incorporates both analytic and intuitive features simultaneously using two adjacent panels, both of which are part of the kinetigram although only Panel 1 happens to have elements that change. Both panels are intended to be simultaneously presented for viewing, with the viewer deciding what to focus on.
Click here for a note on screen resolution and image size.
.
|
What are we looking at? Asking this question is the way I introduce this material to students, and I find that immediately we are all engaged and communicating in a common language. This approach is very tolerant of different learning styles and permits each student to find his or her own point of engagement in a highly nonlinear way that doesn't require suffering through a personally uncongenial, arbitrarily chosen, linear path of access. Furthermore, the great deal of interlinked, constructive variation that is viewable in Panel 1 provides the learner with a very rich medium for personal intuitive unfolding of Makoid-Banakar functions, which goes well beyond merely viewing the individual frames of the movie. Not only are constraints of the model readily extracted from the kinetigram, but more importantly so are a variety of questions and conjectures that lead naturally into an analytic development of the related mathematics.
One interesting visual comparison that can be made, since we have several instances of Makoid-Banakar (M-B) functions with both analytic and graphical representations, involves noticing how these different representations relate to one another. For example, we can readily see that when n = 2, 3, 4, the shape of the corresponding M-B function starts out looking like t2, t3, t4, respectively. Furthermore, the smaller n is, the faster the M-B function ramps up. However, although n is clearly related to the shape of the M-B function, the way in which the other constants relate to the shape seems more subtle. Here we have several instances of functions with both analytic description and graph in which the graph conveys much more useful information. This is an important negative fact to understand concerning analytic descriptions. On the other hand, a positive point, which can now be made and further developed with students, is that the power of the analytic description is its usefulness in explicitly capturing and analyzing the information visible in the graph.
At this point I would be remiss if I did not mention David Tall's seminal paper on the role of visualization in calculus. I did not fully apprehend its significance until recently, after I had been working on kinetigrams and began thinking again about the relationship between intuition and rigour in doing and learning mathematics. Here are two particularly relevant passages from pages 110 and 118, respectively:
|
If we are to fill the gap in students' understanding of the calculus, then I hypothesise that we must find a way that is cognitively appealing to the students at the time the study commences [my italics] yet has within it the seeds for understanding the formal subtleties that occur later... By introducing suitably complicated visualizations of mathematical ideas it is possible to give a much broader picture of the ways in which concepts may be realized, thus giving much more powerful intuitions than in a traditional approach. It is possible to design interactive software to allow students to explore mathematical ideas with the dual role of being both immediately appealing to students and also providing foundational concepts on which the ideas can be built... Thus intuition and rigour need not be at odds with each other. By providing a suitably powerful context, intuition naturally leads into the rigour of mathematical proof. |
I think that Kinetigram Definition 1 is an example of an intuitively oriented mathematical definition that can provide beginning students with immediate, cognitively appealing access to the mathematical objects under development. One obvious improvement would be to include some interactivity in the kinetigram, and as a first step I have written the following Java animation player that will permit the website visitor to stop and control the movie in various helpful ways.
| The Java version of Kinetigram Definition 1, Panels 1 and 2: |
|
Next we have an example of a nice kinetigram exercise. In this exercise tif(t) is the 'tangent intercept function' for f(t). Though it is apparently not well-known to calculus teachers, the analysis and graphing of tif(t) can provide a very natural and different way for the student to see an inflection point of f(t).
| Here is the Java Kinetigram Exercise: |
|
Intuiting Mathematical Objects using Kinetigrams - Kinetigrams: Absorption Models I
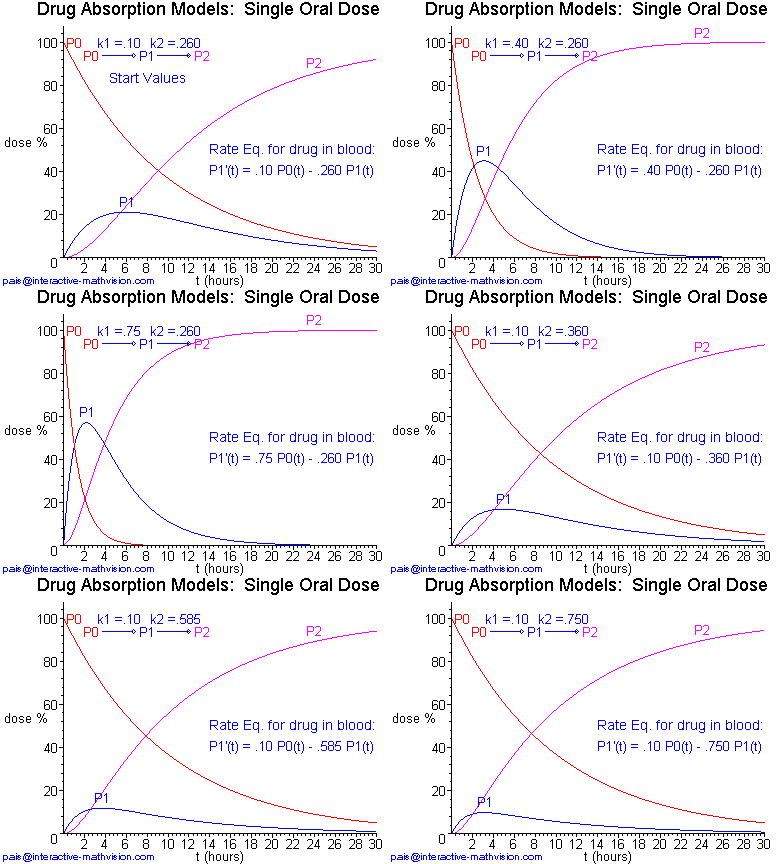
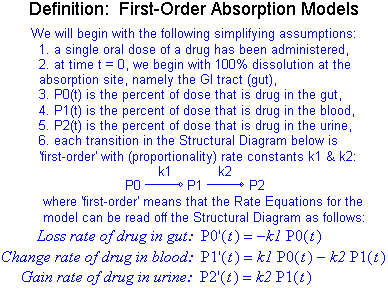
Next, we have a kinetigram definition for a situation in which both absorption and excretion processes are modeled. In contrast to our definitions above, the dissolution process is not directly modeled, however it is accounted for in terms of a simplifying assumption. (Please be patient while the 218 KB animated gif in Panel 1 loads.)
.
|
This kinetigram analytically specifies a first-order absorption model as a linear dynamical system by means of the rate equations, while only implicitly specifying the solution functions for a particular model with given rate constants k1 and k2. Instead of first launching into an explicit derivation of these solution functions, the learner can immediately see several helpful instances of variation. This order of presentation permits one to begin constructing an intuitive mental picture of how a set of three solution functions (the mathematical objects under development) might look. Based upon changes in the analytic specification of the rate equations, the corresponding variation from solution set to solution set can be seen. With this initial understanding in mind, it seems that now the learner is in a position to be very curious about an explicit analytic description of the solution functions, and in particular, how the graphs of these solution functions look and relate to the information already gleaned from the kinetigram.
Once formulas for the solution functions are in hand (see below), one can illustrate the interplay between the physical situation and the mathematical model by asking students, "What happens if the rate constants are the same for both the first and second reactions?" Evidently, if k1 = k2 then we can't use the solution functions described by these formulas. What does this mean physically? Is the mathematics telling us something interesting about the science or vice versa?
![]()


Apparently, the experienced mathematician looks at the rate equations and/or the solution functions and automatically intuits (sees) instances of variation like those in Kinetigram Definition 2, Panel 1. But how does the student inexperienced in mathematical visualization develop such a personal intuitive skill? Using currently available technology, we can create intuitively oriented representations, such as kinetigram definitions, that can rapidly stimulate inexperienced learners to begin generating their own mathematical visualizations to aid in the immediate intuitive unfolding of the mathematical objects under consideration.
| Here is a Java version of Kinetigram Definition 2, Panels 1 and 2: |
Intuiting Mathematical Objects using Kinetigrams - Kinetigrams: Absorption Models II
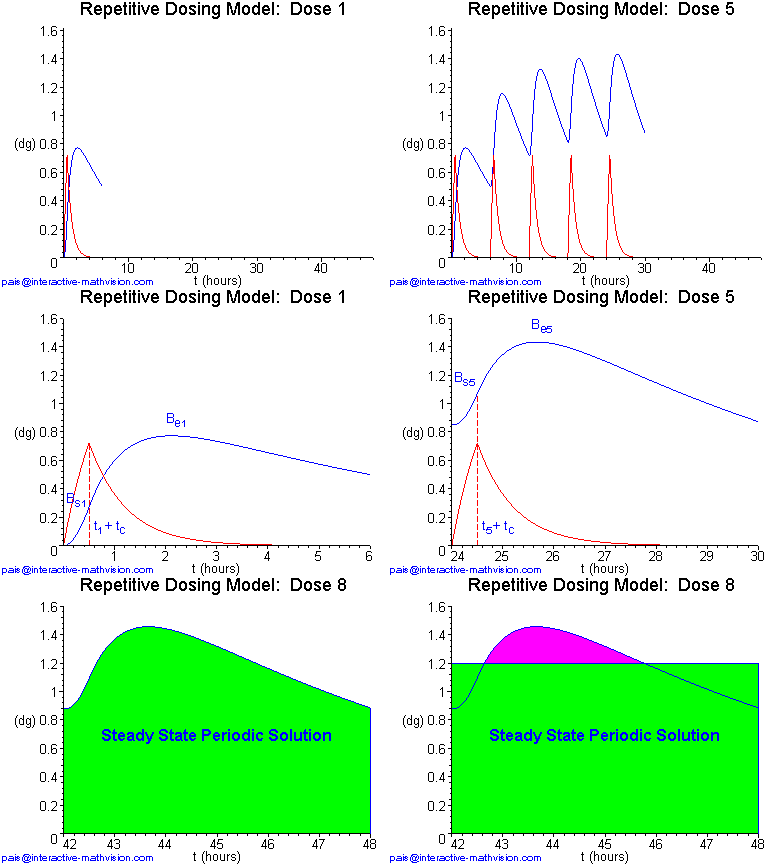
Our final kinetigram definition addresses a situation of repetitive oral dosing of a drug. Here both the dissolution and absorption processes are modeled, but the excretion process is omitted in order to do something interesting while keeping the complexity to a minimum. The basic model described below was introduced in Spitznagel (1992) -- and further discussed in Yeargers et al. (1996) -- for a common decongestant assuming (essentially) a unit dose of 100 mg, a dosing interval of 6 hours, a uniform dissolution rate of 200 mg/hr, and consequent time for complete dissolution of each dose, one half hour. Furthermore, the rate parameters k1 and k2 are determined by the half-lives of this decongestant in the GI tract and in the blood, respectively. The setup for the example in Panel 1 of Kinetigram Definition 3 below is the same as for this decongestant.
Click here for a bit of notation that you may wish to skim briefly and then return to after viewing the kinetigram.
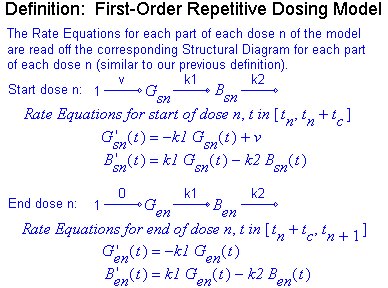
The main idea here is that, since dissolution is turned on only for a part of each dosing interval, we need two functions on each interval to model drug in the gut, and two functions to model drug in the blood. Moreover, these functions need to be appropriately glued together, both inside each dosing interval and from interval to interval.
.
|
In Panel 2 we see that, in order to precisely specify the different pairs of functions on each dosing interval, their analytic description in terms of rate equations becomes still more involved compared to our previous definition. Once again, we immediately provide an example of how these functions might look visually, before considering their explicit analytic descriptions. The example displayed in Panel 1 has been constructed so that information about various features of these functions will be conveyed and further questions will be naturally evoked. One sees that steady state appears to be essentially achieved by dose eight, and that the (whole) drug in the blood function at steady state is periodic but not sinusoidal. Useful exercises that emerge while viewing Panel 1 include finding the minimum, maximum, and average quantity of drug in the blood for each dose and at steady state. An interesting question, whose answer is not clearly visible, is whether the minimum value of drug in the blood on each dosing interval is the same as the value at which it begins. Another question is how to find the steady state solution without going through a sequence of doses, or how to decrease the variation of drug in the blood on each dosing interval. All these exercises and questions now motivate and, in fact, require that we seriously consider the analytic descriptions of our functions and model.
|
Here is a Java version of Kinetigram Definition 3, Panels 1 and 2: |
|
Intuiting Mathematical Objects using Kinetigrams - Hearing Morris Kline's Positive Advice
Suppose we ignore the controversial and scathing indictment of U.S. mathematicians and mathematics teaching found in Kline (1977), and instead try to hear only his constructive suggestions for change. On p. 143 and p. 214, respectively, we find the following two passages:
|
The proper pedagogical approach to any new subject should always be intuitive. The strictly logical foundation is an artificial reconstruction of what the mind grasps through pictures, physical evidence, induction from special cases, and sheer trial and error. ...From a conceptual standpoint [addressed to beginners] the most difficult mathematical subject is calculus. The concepts can be far more readily understood intuitively, and this is how mathematicians grasped the subject until, after two hundred years of effort, they managed to erect the proper logical foundations... |
Kline was a passionate advocate both for the intuitive approach to learning, and for the integration of mathematics and science, believing that the meaning of the mathematical concepts could most effectively be carried and transmitted through the integration of significant applications into the primary content of math courses. His book (Kline, 1967)provides a lovely demonstration of how to do this in calculus, and in (Kline, 1977, pp. 149-150), he discusses why this approach is so important for the student audiences that populate undergraduate mathematics courses in the U.S.:
|
When challenged that the values of mathematics proper do not mean much to potential users, many professors retort that students will learn the applications in other courses. But to ask students to take seriously theorems and techniques whose worth will be apparent one, two, or several years later is a grievous pedagogical error. Such an assurance does not stir up incentive and interest and does not supply meaning to subject matter. As Alfred North Whitehead has advised, whatever value attaches to a subject must be evoked here and now. ...Moreover, the teaching of mathematics is expedited by tying it in with applications. These provide motivation, which mathematics proper does not. Equally important, the only meaning the concepts had for the mathematicians who created them and the only meaning students will find in courses such as calculus derive from physical or, more generally, real situations. |
The best current example I know of a text that integrates life science applications into mathematical content is Yeargers et al. (1996). In addition, I hope that in the present article I have been successful in persuading you that my online text (Pais, 1997-2001) can also make a useful contribution both to potential life science users of mathematics, and to undergraduates who may be merely trying to understand and survive their terminal math experience.
Intuiting Mathematical Objects using Kinetigrams - References
Hersh, R. (1997). What is Mathematics, Really? New York: Oxford University Press, Inc.
Kline, M. (1967). Calculus: An Intuitive and Physical Approach. New York: John Wiley & Sons, Inc.
Kline, M. (1977). Why the Professor Can't Teach: Mathematics and the Dilemma of University Education. New York: St. Martin's Press.
Pais, J. (1997-2001). Calculus for Kinetic Modeling. St. Louis: Interactive MathVision.
Pais, J. (in preparation). Intuiting the Objects of a Mathematical Theory.
Quine, W. V. (1981). Theories and Things. Cambridge: Harvard University Press.
Resnik, M. D. (1997). Mathematics as a Science of Patterns. New York: Oxford University Press, Inc.
Spitznagel, E. (1992). Two-Compartment Pharmacokinetic Models. C-ODE-E, Harvey Mudd College.
Tall, D. (1991). Intuition and Rigour: The Role of Visualization in the Calculus. In W. Zimmermann and S. Cunningham (eds.), Visualization in Teaching and Learning Mathematics. MAA Notes Number 19, Washington: The Mathematical Association of America.
Thurston, W. P. (1994). On Proof and Progress in Mathematics. Bulletin of the American Mathematical Society 30 (2), 161-177.
Tieszen, R. (1998). Gödel's Path from the Incompleteness Theorems (1931) to Phenomenology (1961). Bulletin of Symbolic Logic 4 (2), 181-203.
Yeargers, E. K., R. W. Shonkwiler, and J. V. Herod (1996). An Introduction to the Mathematics of Biology. Boston: Birkhauser.
