The Consumer Price Index and Inflation - Calculate and Graph Inflation Rates
Any of several statistics can be presented in the media as the "Official CPI." One is the index itself (for all urban consumers), as we have used it in this module. Another is the 12-month percent change, such as from August 2001 to August 2002. The annual inflation rate for a given year (say, 1914) is the percent change from the previous year (1913 in this example). Here is the way to calculate the annual inflation rate for 1914:
-
Calculate the difference in the CPI from 1913 to 1914:
 .
.
- Calculate the ratio of this difference to the CPI in 1913, and multiply by 100 to get a percent:
 .
.
So the inflation rate for 1914 was about 1.0%.
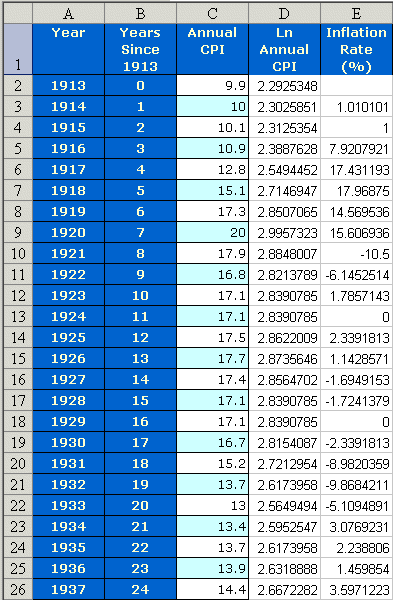
Excel can calculate inflation rates for every year of the CPI except 1913 (when there was no previous year tabulated). In cell E1 of your most recent table (see Figure 9), write Inflation Rate %. In Cell E3 write

The result, approximately 1.0, appears in cell E3. Copy the formula down column E. The result should look like Figure 11. (For tips on making the table more legible, see “Improve the Table.”)
Figure 11. Adding an inflation rate column to the table

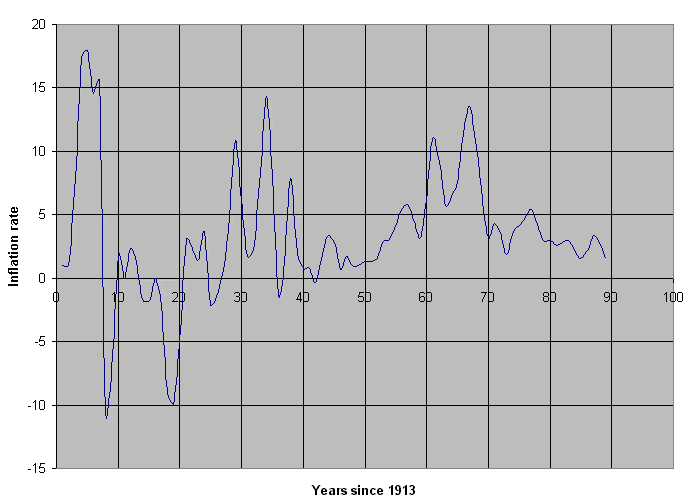
To graph inflation rates, use Columns B and E and continue as on Page 4. (Add a linear trend line if you like.) The result looks like Figure 12, with many fluctuations and a range from -10.5% (1921) to 18.0% (1918).
Figure 12. Annual inflation rates since 1913

You can also get inflation rates and a graph directly from the BLS Web site. Follow the same steps you did in Section 1:
The press often mentions “average inflation rate,” say, for the period 1951 (CPI 26.0) to 2001 (CPI 177.1). This number is not the average of the inflation rates over those years. Instead, it is a percent such that, if the CPI grew at that annual rate, compounded, from 1951 (26.0) to 2001, the same result of 177.1 would occur in 2001. The actual inflation rate fluctuated greatly, as you saw in Figure 12. But suppose it had been 4% (0.04 as a decimal) every year. Then the CPI would have grown by a factor of 1.04 each year, starting at 26.0. After 50 years -- 1951 to 2001 -- the CPI would be 
 . Since 185 is larger than 177.1, 4% is a little too big. Let's calculate the correct average rate.
Call the decimal rate x. Since the CPI went from 26.0 to 177.1 over a period of 50 years, we know that  . Thus,
  .
.
- Solve this equation for x. Answer as a percent, rounded to two decimal places. You can either raise each side to the 1/50 power or use logarithms. (Do it both ways to check your work!) You should find that the average inflation rate is a little less than 4%.
As is often the case with averages, the actual rates in this 50-year period do not cluster around the average. They vary from –0.4% (1955) to 13.5% (1980). See “Inflation and Deflation” for more information about positive and negative growth rates in the CPI.