- About MAA
- Membership
- MAA Publications
- Periodicals
- Blogs
- MAA Book Series
- MAA Press (an imprint of the AMS)
- MAA Notes
- MAA Reviews
- Mathematical Communication
- Information for Libraries
- Author Resources
- Advertise with MAA
- Meetings
- Competitions
- Programs
- Communities
- MAA Sections
- SIGMAA
- MAA Connect
- Students
- MAA Awards
- Awards Booklets
- Writing Awards
- Teaching Awards
- Service Awards
- Research Awards
- Lecture Awards
- Putnam Competition Individual and Team Winners
- D. E. Shaw Group AMC 8 Awards & Certificates
- Maryam Mirzakhani AMC 10 A Awards & Certificates
- Two Sigma AMC 10 B Awards & Certificates
- Jane Street AMC 12 A Awards & Certificates
- Akamai AMC 12 B Awards & Certificates
- High School Teachers
- News
You are here
Designing Attribute Acceptance Sampling Plans - Design of a Single Attribute Sampling Plan
Suppose we want to design a single attribute sampling plan so that
-
a good lot with a defective rate of 2% will be accepted 95% of the time
 , and
, and -
a bad lot with a defective rate of 10% will be accepted 15% of the time
 .
.
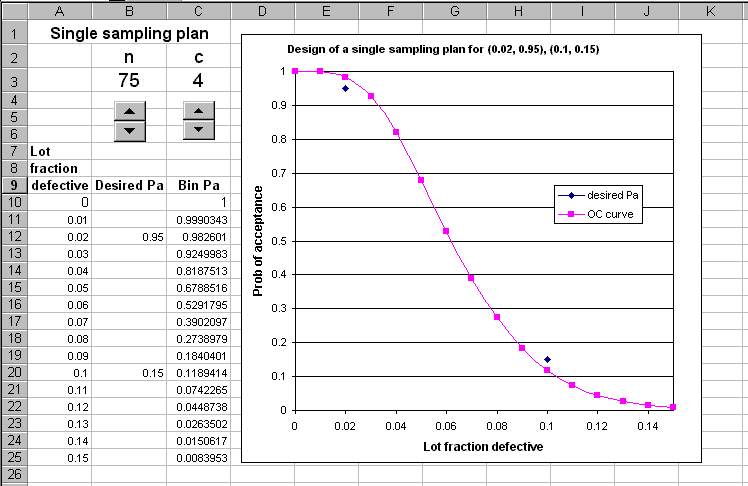
In other words, we want to find an attribute sampling plan whose OC curve passes through the two points (0.02, 0.95) and (0.1, 0.15). How can we design a plan (i.e., choose appropriate values of n and c) that satisfies these criteria? We suppose that the lot size is large as compared with the sample size, so the Binomial approximation suffices. We could use a mathematical approach (Wetherill, 1969), but we can also make use of the Spin Button to design the desired sampling plan.
Here is the spreadsheet for designing a sampling plan (n, c) for (0.02, 0.95) and (0.1, 0.15). As before, you can click on the chart to get to the Excel environment. Use the Spin Button to change the values of n and c. You will see that the acceptance number has a much greater effect on the Pa and hence the shape of the OC curve than the sample number.
After experimenting with values of n and c, you should find that the sampling plan which has an OC curve approximately passing through the two points (0.02, 0.95) and (0.1, 0.15) is n = 61, c = 3.
Steve H. K. Ng, "Designing Attribute Acceptance Sampling Plans - Design of a Single Attribute Sampling Plan," Convergence (October 2004)


