- About MAA
- Membership
- MAA Publications
- Periodicals
- Blogs
- MAA Book Series
- MAA Press (an imprint of the AMS)
- MAA Notes
- MAA Reviews
- Mathematical Communication
- Information for Libraries
- Author Resources
- Advertise with MAA
- Meetings
- Competitions
- Programs
- Communities
- MAA Sections
- SIGMAA
- MAA Connect
- Students
- MAA Awards
- Awards Booklets
- Writing Awards
- Teaching Awards
- Service Awards
- Research Awards
- Lecture Awards
- Putnam Competition Individual and Team Winners
- D. E. Shaw Group AMC 8 Awards & Certificates
- Maryam Mirzakhani AMC 10 A Awards & Certificates
- Two Sigma AMC 10 B Awards & Certificates
- Jane Street AMC 12 A Awards & Certificates
- Akamai AMC 12 B Awards & Certificates
- High School Teachers
- News
You are here
Estimating the Area of Virginia - Using Trapezoids

1. Getting Started
![]() Click the button at the right to open a MAPLE worksheet entitled trapstudent.mws. If you are given a choice, you should save the file to your preferred directory, then navigate to that directory and open the file from there. In the MAPLE worksheet, position your cursor anywhere in the line [ > restart ; and press Enter. Pressing the Enter key executes the MAPLE code on the current line. Activating the restart MAPLE command will clear all MAPLE variables, and it is important to do this whenever you start a new MAPLE project.
Click the button at the right to open a MAPLE worksheet entitled trapstudent.mws. If you are given a choice, you should save the file to your preferred directory, then navigate to that directory and open the file from there. In the MAPLE worksheet, position your cursor anywhere in the line [ > restart ; and press Enter. Pressing the Enter key executes the MAPLE code on the current line. Activating the restart MAPLE command will clear all MAPLE variables, and it is important to do this whenever you start a new MAPLE project.
Now resize your MAPLE and browser windows so that you can see them both, side-by-side. Click in either window to make it the active window.
Your screen should look something like this:
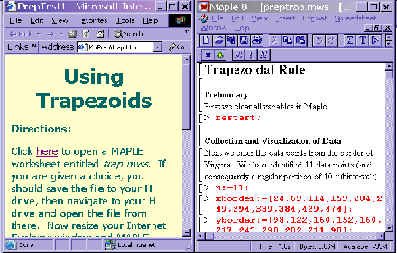
2. Collection of Data
 Notice that the MAPLE worksheet needs your input of the coordinates of points from a map of Virginia. We will use the Virginia map you saw earlier to find and mark these points. Click the picture at the right to learn how to get the point coordinates and store your coordinates in the MAPLE worksheet.
3. Visualization of Data
Now that you have entered your x and y coordinates, you can work through the MAPLE worksheet by pressing the Enter key on your computer to execute the MAPLE commands. (Note: The MAPLE window must be the active window.) The first output you see should be a red horizontal line (the southern border of Virginia) and eleven black points (the eleven, evenly spaced boundary points that you determined in section 2). You should be able to "see" that this line and eleven points give a rough outline of the state of Virginia. Repeat sections 2 and 3 until you are satisfied that you have obtained a reasonable rough outline of the state of Virginia.
4. Construction of Approximating Trapezoids
This section includes the MAPLE commands that define the 10 linear functions we will use to construct our trapezoidal approximation. Press the Enter key to execute the block of MAPLE commands.
5. Visualization of Approximating Trapezoids
This section begins with a loop of MAPLE code that defines the vertical partition lines and ends with a display of the ten approximating trapezoids. Does the red outline look like Virginia? Compare your picture with the one at the top of this page. Note that the trapezoids extend from the northern red boundary of Virginia to the x-axis.
6. Area Calculation Using Geometric Formulas
These MAPLE commands compute the sum of the area of the individual trapezoids. (Each of these trapezoids extends to the x-axis.) This sum includes the area of the red region (the state of Virginia) as well as the area of the rectangular region between the southern boundary of Virginia and the x-axis. Thus, our trapezoidal approximation (in square pixels) must be adjusted.
7. Area Calculation Using Integrals
MAPLE commands in this section use integrals to compute the sum of the area of the individual trapezoids. (Note: Integration is not necessary when using trapezoids, but it will be necessary inthe next section when we use parabolas in Simpson's rule.)
8. Solution
We must now convert square pixels to square miles. Use the map scale to determine how many pixels are equivalent to 80 miles. In the MAPLE worksheet, determine the conversion factor from square pixels to square miles and use this factor to determine the trapezoidal approximation (using 10 subintervals) for the area of Virginia.
9. Trapezoidal Summary
![]() The image at the top of this page shows the trapezoidal approximation superimposed on the map of Virginia. Use this image to determine whether this trapezoidal approximation using 10 subintervals is an over- or under- approximation. Explain your reasoning and include your response in the text cell provided in the MAPLE worksheet. Save your worksheet as trap10****.mws. (Replace the **** with your first initial and last name.)
The image at the top of this page shows the trapezoidal approximation superimposed on the map of Virginia. Use this image to determine whether this trapezoidal approximation using 10 subintervals is an over- or under- approximation. Explain your reasoning and include your response in the text cell provided in the MAPLE worksheet. Save your worksheet as trap10****.mws. (Replace the **** with your first initial and last name.)
Assignment
The purpose of this assignment is to increase the accuracy of our approximation by using more trapezoids. In this assignment, you will repeat the above process based on the collection of more data points.
Step 1: Open your trap10****.mws worksheet and save it as trap30****.mws. (You now have two copies of the same worksheet.)
Step 2: Use a live map of Virginia to collect 31 evenly spaced points on the northern boundary of Virginia. Your first point must be (24, 98) and the last point must be (474, 98). Paste these coordinates into your trap30****.mws worksheet.
Step 3: Repeat sections 3-9 (above) for your new data points by modifying your trap30 worksheet.
Julie Clark, Caren Diefenderfer, Steve Hammer, and Trish Hammer,, "Estimating the Area of Virginia - Using Trapezoids," Convergence (December 2004)


