Lite Applets and a Spreadsheet or Computer Algebra System
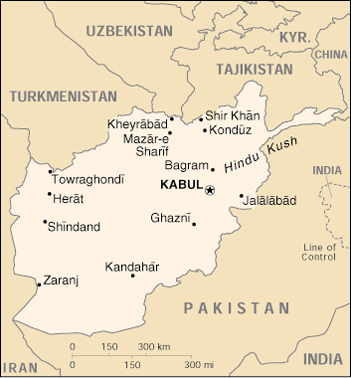
The live image above looks very similar to the live image in the last section, except that by changing a few of the parameters calling the applet, Image_and_Cursor, three new buttons are created that enable the user to copy data produced by this applet into a spreadsheet (or a computer algebra system). In this form, the applet might be used in a module that would lead students to discover how to estimate the length of a complicated curve like the border between Afghanistan and Iran. If your computer has Excel or another spreadsheet, you might try this as follows.
- First move this window over to the right side of your screen to free up one or two inches of space at the left of the screen.
- Next launch your spreadsheet with a blank worksheet. Position the spreadsheet at the left of the screen. Your screen should look something like the picture below with the spreadsheet window peeking out from behind this browser window.
- Now mark a series of points along the border between Afghanistan and Iran by positioning the cross hairs at each point in turn and clicking the Mark point button.
- After you have marked a series of points along the border, click the List points button.
- After a few seconds a new window will appear with the coordinates of the points you marked. Move this window to the right so that it does not obscure the spreadsheet window peeking out from behind the browser window.
- Now highlight the data in this window in the usual way by clicking and dragging or by using a combination of clicking and shift-clicking.
- The next step is to copy-and-paste the highlighted data into the spreadsheet. The way in which this is done depends on your operating system. You may be able to simply drag the highlighted data into the spreadsheet, or you may have to copy it using either control-c (Windows) or command-c (MacOS) and then paste it using either control-v (Windows) or command-v (MacOS). You can also copy-and-paste using the right mouse button and pop up menu on Windows machines.
- Once you have the data in your spreadsheet you can compute the length of each segment of your polygonal approximation to the border. Then compute the sum of the lengths. Finally convert the length of the border measured in pixels into either miles or kilometers using the scale on the map.
The Border Between Afghanistan and Iran is a student-ready module using this image and applet as described above.

The html code above shows how the applet Image_and_Cursor is called on this page. There are just a few changes from the applet call in the preceding section.
- The parameter display_sw now has the value 1 to specify the inclusion of the three buttons at the right enabling the user to record and display data.
- The parameter cas_sw is set to the value 2 indicating that data should be displayed in a form suitable for a spreadsheet. Data can also be displayed in a form suitable for Maple, MathCAD, or Mathematica.
- The applet width is larger to allow room for the new buttons.
You will need the following files to use this applet. They should all be placed in the same directory as the html page you are now reading. There are several ways in which you can save the html page you are now reading, depending on your operating system and browser. One sure way that works with all combinations is to choose Source from the View menu, select the enitre text; and then copy it into a new document in whatever text processing program you use for working with html -- for example, Notepad on Windows machines or TextEdit on Mac OSX. You can also paste selected portions of this file into html pages created using programs like DreamWeaver or Front Page.
The next section shows how Lite applets can be used together with forms and Javascript to create even more interactive modules without writing Java programs.
[Continue]