


The purpose of this note is to look at how we can analyze data that we believe might be described using either a linear model or an exponential model. We are interested in three kinds of models:
We are often interested in fitting one of these families of models to a set of data -- that is, to see if one of these models can be used to describe a relationship that exists between two variables in a data set. Click here to open a new window with data in the form of a table for an example that illustrates this discussion. Click here to open a live figure with the same data as a scatter plot. We would like to describe this data using a model of the form:
This is a variation on the form we used above for a linear model. The parameter m still denotes the slope but now the parameter b denotes the world record for the one mile run in the year 1860. We use this form because the left edge of the graph is at the year 1860. Use the parameter controls to change the values of the two parameters -- m and b so that the linear function is as close as possible to the data.
Now we want to look at how we can estimate the slope -- that is, the value of the parameter m -- by looking at the data. This process is often called data snooping. We will work with the form:
Suppose that (x1, y1) and (x2, y2) are two points on the graph of this function. This is,

and

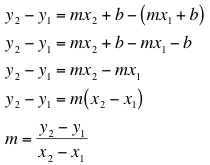
Our data does not usually give us points that are exactly on this line but it does give us points that are close to the line. Thus, using two data points we can get an estimate that is close to the exact value of m.
Example:
We will use the world record for the mile run in 1880 and the world record for the mile run in 1945 as our two data points. Thus,
and
This leads to the estimate

Questions:

to estimate the value of the slope. This shows that we are justified in using the same letter and the same terminology for m in both forms.
Linear models are appropriate when the change in the dependent variable, y, is a constant multiple (namely, the slope m) of the change in the independent variable, x. We use words like -- "The world record for the one mile run is changing at the constant rate of -0.34 seconds per year." In many cases the change in the dependent variable cannot be described in this way. For many common situations words like -- "The level of pollution is dropping at the constant rate of 7 percent per year" -- are more accurate. In these situations we use simple exponential models. We look at data snooping in these situations next.